Self Storage Industry Statistics 2026: Facilities, Occupancy, Rents and Demand
Quick answer
The key self storage industry statistics for 2026: the U.S. had 57,981 self storage facilities with 2.65 billion rentable square feet, per Radius+ data in the 2025 Self-Storage Almanac, and 12.6% of households used self storage (SSA, 2025). The national average advertised rate was $16.21 per square foot a year in September 2026, below a year earlier, while Q3 2026 same-store occupancy at Public Storage, Extra Space Storage and CubeSmart ran from 90.5% to 94.3%. Census data shows 18,564 employer establishments in 2023, up 9.8% since 2019.
I pulled these self storage industry statistics together because owners keep asking me the same things: how crowded is my market, are rents rising or falling, and is marketing worth the money right now. I manage Google Business Profiles, websites and social media for facilities managed by Joules Storage Management in Texas, so I watch these self storage facts every month.
Every figure comes from a source I opened in November 2026, or from U.S. Census Bureau data I analyzed myself, and each one carries its own date. I’ve also added results from my own study of 123 self storage websites. To see where your facility stands first, run the free self storage SEO audit tool. It takes about 30 seconds.
Key statistics at a glance
57,981
self storage facilities in the U.S. (Radius+ count)
Source: Self-Storage Almanac 2025
2.65B
rentable square feet of U.S. self storage
Source: Self-Storage Almanac 2025
12.6%
of U.S. households use self storage
Source: SSA 2025 Demand Study, via CRE Daily
$16.21
average advertised rate per sq ft per year, September 2026
Source: Yardi Matrix, 2026
94.3%
Extra Space Storage same-store occupancy, Q3 2026
Source: Extra Space Storage, 2026
2.1%
of existing inventory under construction, September 2026
Source: Yardi Matrix, 2026
18,564
employer establishments in 2023, up 9.8% from 2019
Source: Hawkto analysis of Census CBP
97%
of consumers read reviews for local businesses
Source: BrightLocal, 2026
In this guide
- Self storage market size: facilities and square feet
- US self storage industry statistics by state (Census data)
- Self storage occupancy and demand
- Self storage rents and street rates
- New self storage construction and supply
- Who rents self storage and why
- How renters find and choose a facility
- Self storage website statistics: our 123-site study
- What the numbers mean for marketing your facility
- Self storage industry trends to watch in 2026
- Frequently asked questions
- Sources
For storage owners and managers
Want this done for your facility?
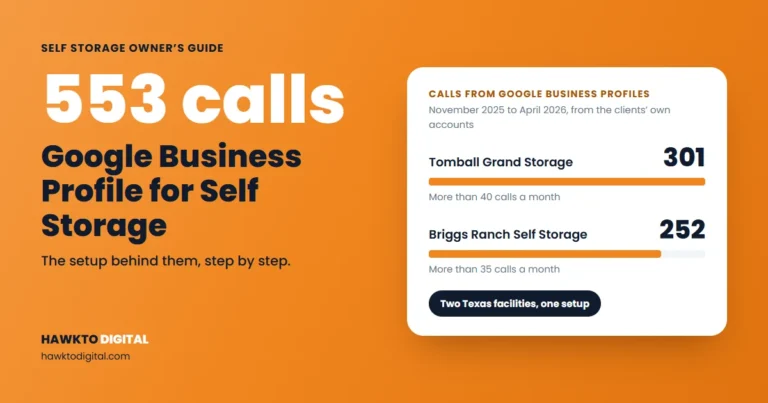
I market self storage facilities in Texas, including Briggs Ranch Self Storage, which got 252 calls from its Google Business Profile in 6 months. See how I can help with self storage marketing.
See self storage marketing servicesScore your facility website free
Self storage market size: facilities and square feet
There is no government count of self storage facilities, so national totals come from private databases. The most quoted is Radius+, published in the Self-Storage Almanac. In the 2025 edition, U.S. facilities rose from 52,301 to 57,981, and rentable space from about 2.10 billion to 2.65 billion square feet (Self-Storage Almanac 2025).
- Most facilities: Texas, with 6,265.
- Most space per person: Idaho, at 15.7 square feet per resident.
- Space per American: 2.65 billion square feet divided by the Census 2024 population estimate of 340.1 million is about 7.8 square feet per resident (Hawkto arithmetic, using Census population estimates).
Yardi’s StorageCafe counts differently: more than 50,000 facilities and more than 2.2 billion square feet in 2026 (StorageCafe, October 2026). Always say which count you’re quoting.
The largest public operators
As of September 30, 2026:
| Company | Locations | Q3 2026 same-store occupancy | Realized rent per occupied sq ft per year |
|---|---|---|---|
| Public Storage (Q3 release) | 4,764 facilities owned and/or operated, about 339 million sq ft, in 42 states, Puerto Rico and Canada | 92.2% | $22.29 |
| Extra Space Storage (Q3 release) | 4,411 stores owned and/or operated, 342.2 million sq ft, in 43 states and D.C. | 94.3% | Not in release |
| CubeSmart (Q3 release) | 662 owned stores (48.5 million sq ft) plus 882 managed for others (58.2 million sq ft) | 90.5% | $22.81 |
National Storage Affiliates is no longer independent: Public Storage completed its acquisition on July 22, 2026, and bought Public Storage Canada on September 1.
What this means for owners: most of your competitors are small.
These three run about 10,700 locations between them (a few in Canada), so most facilities belong to smaller owners. Your map rivals are mostly independents, and a strong Google profile and website can beat them.
US self storage industry statistics by state (Census data)
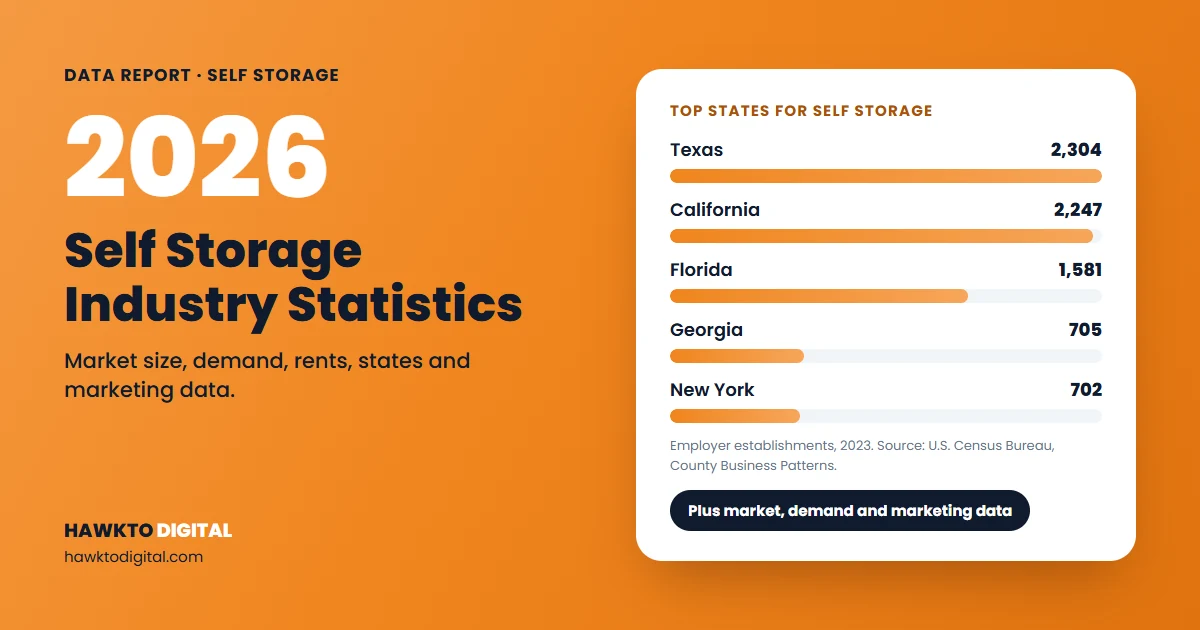
For a government number, I analyzed the U.S. Census Bureau’s County Business Patterns (CBP) state files for NAICS 531130, “Lessors of Miniwarehouses and Self-Storage Units”. This is Hawkto’s own analysis. In 2023 there were 18,564 employer establishments, up from 16,904 in 2019, growth of 9.8%. They had about 48,400 paid employees in mid-March 2023 and $1.96 billion in annual payroll, or 5.5 establishments per 100,000 residents.
Read this carefully: CBP counts only employer establishments. An establishment is a single physical location where business is conducted, and CBP excludes businesses without paid employees (CBP methodology). Many storage facilities have no staff on site or are run by owners who aren’t on a payroll, so they never appear.
| Rank | State | Establishments, 2023 | 2019 | Change | Per 100,000 residents |
|---|---|---|---|---|---|
| 1 | Texas | 2,304 | 2,132 | +8.1% | 7.5 |
| 2 | California | 2,247 | 2,182 | +3.0% | 5.7 |
| 3 | Florida | 1,581 | 1,355 | +16.7% | 6.9 |
| 4 | Georgia | 705 | 616 | +14.4% | 6.4 |
| 5 | New York | 702 | 622 | +12.9% | 3.6 |
| 6 | North Carolina | 645 | 587 | +9.9% | 5.9 |
| 7 | Illinois | 572 | 510 | +12.2% | 4.5 |
| 8 | Washington | 535 | 541 | -1.1% | 6.8 |
| 9 | Arizona | 530 | 453 | +17.0% | 7.1 |
| 10 | Virginia | 511 | 484 | +5.6% | 5.9 |
Top 10 states by self storage employer establishments (NAICS 531130). Hawkto analysis of Census County Business Patterns 2023 and 2019; per-capita figures use Census 2023 population estimates.
Self storage employer establishments per 100,000 residents, top 10 states
Establishments in NAICS 531130 per 100,000 residents, 2023
Mountain West states lead per person. Among the 10 biggest states, Arizona and Florida grew fastest; Washington alone shrank.
Self storage industry statistics: two ways to count facilities
Number of locations
The Census count is about 32% of the Radius+ national count, and about 37% in Texas. They measure different things on different dates, so use the Census figures to see where staffed storage businesses are growing, not as a facility count.
What this means for owners: check your own area, not the national average.
Before a promotion or expansion, count the facilities within a short drive on Google Maps and compare their review counts with yours.
Self storage occupancy and demand
Occupancy depends on who runs the facility. In Q3 2026, average same-store occupancy was 94.3% at Extra Space Storage (Extra Space), 92.2% at Public Storage, up from 91.9% (Public Storage), and 90.5% at CubeSmart, up from 89.9% (CubeSmart).
Yardi Matrix tracks a broader group: properties with commercial mortgage-backed (CMBS) loans. Their occupancy averaged 85.3% in June 2026, 670 basis points below the REIT same-store figure. Within that pool, REIT-owned properties averaged 90.8% and third-party managed ones 86.3% (Yardi Matrix via Multi-Housing News).
Self storage occupancy by owner type, 2026
Average occupancy, %
How many households use self storage
The Self Storage Association’s 2023 Demand Study found 14,465,722 of 130,023,135 U.S. households using self storage, or 11.1%, as reported in the 2025 Self-Storage Almanac. The 2025 edition puts household usage at 12.6%, according to CRE Daily. The full study is sold by the SSA.
What this means for owners: operators with better systems fill more space.
REIT-run properties beat third-party managed ones by 4.5 points in the same loan pool. Fast replies, online rentals and steady reviews don’t need a REIT budget.
Self storage rents and street rates
Yardi Matrix publishes a national average advertised (street) rate each month, annualized per square foot across a mix of unit types. It has moved in a narrow band:
| Data month | Advertised rate per sq ft per year |
|---|---|
| December 2025 | $16.32 |
| January 2026 | $16.27 |
| February 2026 | $16.10 |
| March 2026 | $16.07 |
| April 2026 | $16.22 |
| May 2026 | $16.34 |
| June 2026 | $16.48 |
| July 2026 | $16.47 |
| August 2026 | $16.39 |
| September 2026 | $16.21 |
Yardi Matrix national self storage reports, January to October 2026 editions, via Multi-Housing News. Each month links to its report.
Year over year, the rate was up 0.3% in December 2025, then down 0.2% in January, 1.1% in February and 2.0% in March. In September 2026 it fell 1.2% from August, with declines in all 30 major metros, and was down 1.6% year over year for non-climate-controlled units and 2.1% for climate-controlled (Yardi Matrix).
Per unit, StorageCafe put the average 10×10 non-climate-controlled unit at $119 a month in October 2026, down 0.8% year over year, and about $133 for climate-controlled (StorageCafe).
Street rates vs. what existing tenants pay
Existing tenants pay far more than the move-in rate: a realized $22.29 per occupied square foot a year at Public Storage in Q3 2026 and $22.81 at CubeSmart. They include rent increases on long-stay tenants, so they aren’t directly comparable with Yardi’s average. Yardi says the gap between in-place and street rates is limiting revenue growth (September 2026 report).
What this means for owners: compete on visibility, not only price.
With street rates falling, cutting your rate is the easy move and usually the costly one. Winning more local searches protects your rate.
New self storage construction and supply
Two StorageCafe figures for 2025 completions disagree. A December 23, 2025 article put deliveries at 51 million square feet, 2.4% of inventory and 21% below 2024 (StorageCafe). Its October 2026 statistics page says almost 58.5 million square feet were finished in 2025, 2.8% of inventory (StorageCafe). The first came out before the year ended, so the later figure likely includes late-reported projects. I’d quote 58.5 million.
- 2026: StorageCafe forecasts roughly 53.1 million square feet of completions. It says 291.3 million square feet were built over the last five years.
- Pipeline, September 2026: Yardi Matrix tracked 2,324 projects: 594 under construction, 1,443 planned and 287 prospective. The 43.8 million square feet under construction equaled 2.1% of inventory, down 40 basis points in a year (Yardi Matrix).
- Busiest metros: Phoenix (5.8% of inventory under construction), the New York suburbs (4.3%) and Austin (4.1%). Minneapolis was lowest at 0.7%.
Self storage space under construction in the U.S., Dec 2025 to Sep 2026
Net rentable square feet under construction, millions
What this means for owners: new competitors keep opening, just more slowly.
A new facility nearby opens with fresh photos and launch offers. Get your profile and reviews in shape before it does.
Who rents self storage and why
StorageCafe surveyed 1,430 people between November 2025 and June 2026 on its own rental websites (StorageCafe, 2026):
- 26% currently rent a unit and 28% plan to. Homeowners lead (29% now), ahead of renters (21%).
- Gen X is most likely to rent (35%), then Boomers (32%). Only 13% of Gen Z rent today, but 32% plan to.
- Lack of space at home is the top reason, followed by moving.
- Price is the top factor in choosing a facility (28% of responses), then location (17%) and 24/7 access (13%).
The 26% is a share of respondents; the SSA’s 12.6% is a share of households.
What this means for owners: show price and location first.
Put prices on your website and Google profile, say plainly which neighborhoods you serve, and name features like 24/7 access or climate control in your headings.
How renters find and choose a facility
Google says local results are based mainly on relevance, distance and prominence, and that more reviews and positive ratings can help local ranking (Google Business Profile Help). BrightLocal’s 2026 survey of 1,002 U.S. adults shows how people use reviews (BrightLocal, 2026):
How consumers use reviews to choose a local business, 2026
% of U.S. consumers
For storage, two numbers stand out. Visiting the website is the most common step after a good review, so your site must finish the job. And AI tool use jumped from 6% to 45% in a year; those tools draw on the same reviews, listings and website text.
What this means for owners: fresh reviews are now the baseline.
Ask every new tenant for a Google review in their first week and reply to every review. Aim for at least 20 recent reviews and a rating above 4.5.
Self storage website statistics: our 123-site study
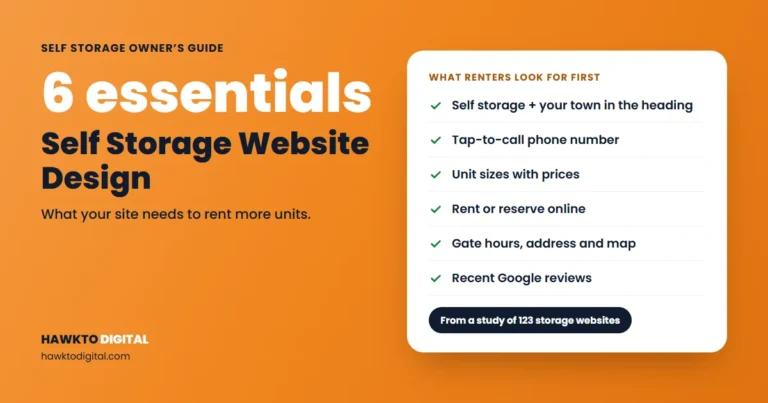
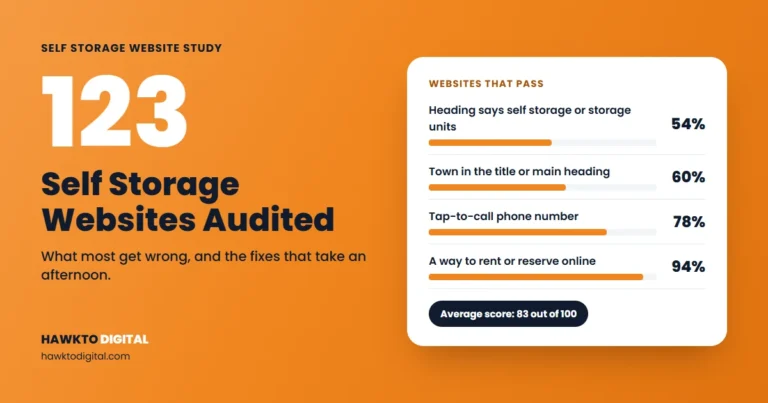
In November 2026 I ran 19 checks on 123 independent self storage websites in 14 states. The method and full results are in the self storage website study. The average score was 83 out of 100.
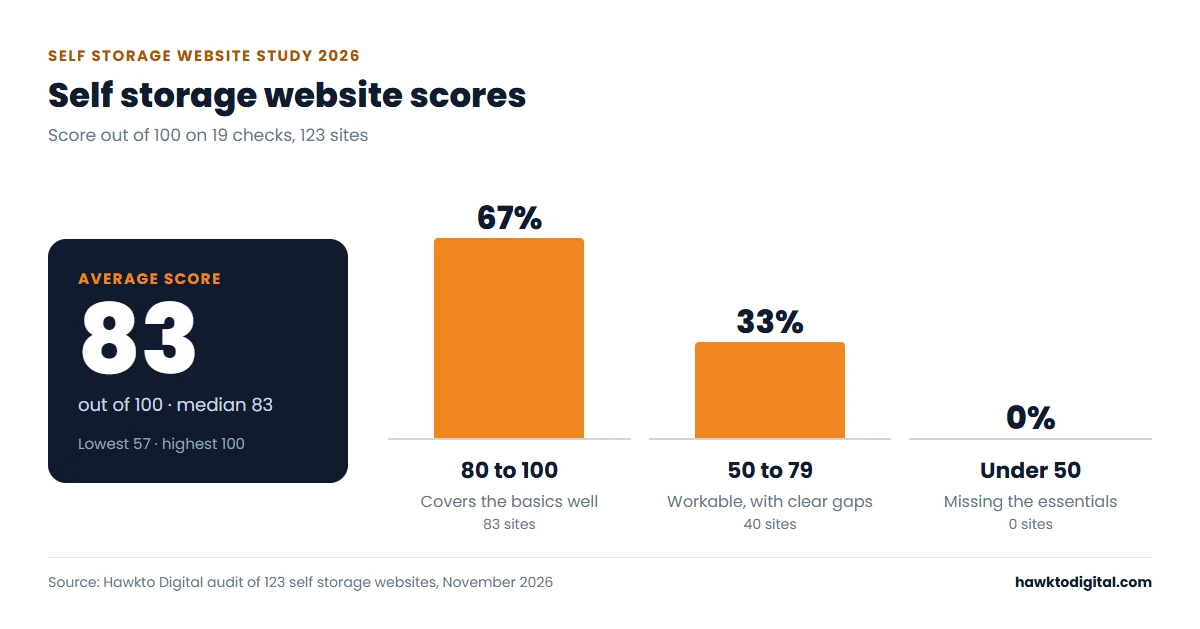
Self storage website study: share of 123 sites
% of independent self storage websites, November 2026
The basics are mostly there. The gaps are in telling Google what the facility is and where, and a site with no reviews or an untappable number loses visitors your Google profile just sent.
What this means for owners: most fixes take an afternoon.
A heading that says “Self Storage in [Town], [State]”, a tap-to-call number, three recent reviews and SelfStorage schema cover most gaps. The self storage website design guide explains each one.
What the numbers mean for marketing your facility
Put together: street rates are soft, new supply keeps arriving, and renters choose from the few facilities Google shows nearby, judged on reviews, price and distance. The winners show up and look trustworthy in local search.
I see it with my own clients. After a full Google Business Profile optimization, Briggs Ranch Self Storage in Texas (managed by Joules Storage Management) got 252 calls from its Business Profile between November 2025 and April 2026, more than 35 a month. Tomball Grand Storage in Texas got 301 calls over the same months, more than 40 a month. And one facility site I work on, SS Near Me – Center Point, had 243 active users in Google Analytics over the last 90 days, up 153.1% on the previous 90 days.
Your checklist for this quarter
- Google Business Profile: right category, hours, unit sizes, photos and your town in the description. Google says complete, accurate profiles are more likely to show in local results. See the Google Business Profile guide for self storage.
- Reviews: ask every new tenant and reply to every review.
- Website: fix the heading, town, tap-to-call and schema gaps and show prices. Check it with the self storage SEO audit tool.
- Local SEO: a page for each town you serve, with the same name, address and phone everywhere. See the self storage SEO guide and more self storage marketing ideas.
I walk through the Google Maps side step by step in this video:
Prefer reading? See how to rank higher on Google Maps, or hand it off with Google Business Profile optimization.
Self storage industry trends to watch in 2026
- Consolidation. Public Storage added over 1,100 stores in 2026 by buying National Storage Affiliates and Public Storage Canada.
- More third-party management. On September 30, 2026, Extra Space managed 1,963 stores for third-party owners plus 408 in joint ventures, CubeSmart 882 and Public Storage 493 (including those under contract).
- A shrinking pipeline. Space under construction fell from 2.7% of inventory in December 2025 to 2.1% in September 2026 (Yardi Matrix).
- Soft rates. Yardi Matrix says weak demand and elevated supply still pressure the recovery, even as construction slows (November 2026 report).
- AI and higher review standards. 45% of consumers used AI tools for local recommendations in 2026, and 31% want 4.5 stars or more, up from 17% (BrightLocal).
Self storage statistics FAQ
Frequently asked questions
Quick answers to the questions owners, lenders and writers ask most.
QHow many self storage facilities are there in the US?
Radius+ data in the 2025 Self-Storage Almanac counts 57,981 U.S. facilities. StorageCafe says more than 50,000. The Census Bureau counted 18,564 employer establishments in 2023, but that only covers locations with paid employees.
QWhat is the average occupancy rate for self storage in 2026?
In Q3 2026, same-store occupancy was 94.3% at Extra Space Storage, 92.2% at Public Storage and 90.5% at CubeSmart. Yardi Matrix put it at 85.3% for properties with CMBS loans in June 2026.
QHow much does a storage unit cost per month in 2026?
StorageCafe put the national average for a 10×10 non-climate-controlled unit at $119 a month in October 2026, and about $133 for a climate-controlled 10×10.
QWhat percentage of Americans use self storage?
The Self Storage Association’s 2025 Demand Study puts household usage at 12.6%, as reported by CRE Daily, up from 11.1% in 2023. StorageCafe’s 2026 survey found 26% of respondents rent a unit, but it measures people, not households.
QWhich state has the most self storage facilities?
Texas, with 6,265 facilities per Radius+ data in the 2025 Almanac and 2,304 Census employer establishments in 2023. Per resident, Wyoming leads with 9.2 employer establishments per 100,000 people.
QIs the self storage industry still growing?
Yes, but more slowly. Employer establishments grew 9.8% from 2019 to 2023 and about 58.5 million square feet opened in 2025, but space under construction fell to 2.1% of inventory by September 2026.
Sources
Sources
Checked in November 2026.
- Modern Storage Media, Self-Storage Almanac 2025, Section 1: Industry Data (Radius+ facility and square footage data; SSA 2023 Demand Study figures)
- Self Storage Association, Research Data: 2025 Self Storage Demand Study
- CRE Daily, Self Storage Industry Stabilizes Amid Demand and Supply Shifts, September 17, 2025 (SSA 2025 Demand Study household figure)
- Multi-Housing News, Yardi Matrix Self Storage National Report, 2026 editions: January, February, March, April, May, June, July, August, September, October
- Public Storage, Third Quarter 2026 Results, October 26, 2026
- Extra Space Storage, 2026 Third Quarter Results (SEC Form 8-K, Exhibit 99.1), October 27, 2026
- CubeSmart, Third Quarter 2026 Results (SEC Form 8-K, Exhibit 99.1), October 29, 2026
- StorageCafe (Yardi), Self Storage Industry Statistics, October 2026
- StorageCafe, Where Self Storage Boomed in 2025, December 23, 2025
- StorageCafe, Self Storage Demand and Trends 2026 survey, September 2, 2026
- BrightLocal, Local Consumer Review Survey 2026, February 11, 2026
- Google Business Profile Help, Tips to improve your local ranking on Google
- U.S. Census Bureau, County Business Patterns 2023 and 2019 state files, NAICS 531130 (Hawkto analysis)
- U.S. Census Bureau, County Business Patterns methodology
- U.S. Census Bureau, State population estimates, Vintage 2024
- Hawkto Digital, self storage website study of 123 sites, November 2026
Cite this data
You’re welcome to use any chart or figure from this page in articles, reports and presentations. Please credit Hawkto Digital and link to this page.
Hasan, M. (2026). Self Storage Industry Statistics 2026. Hawkto Digital. https://hawktodigital.com/self-storage-industry-statistics/
See how your facility stacks up
Run the same 19 checks from the website study on your own site. It’s free, it takes about 30 seconds, and every problem comes with a plain-English fix.
Score my facility websiteSee self storage marketing services

About the author
Mehedi Hasan is the founder of Hawkto Digital and is Google, HubSpot and Semrush certified. He markets self-storage facilities and RV parks for operators in the US, covering Google Business Profiles, local SEO, Google Ads, websites, social media and email. Read his story or see pricing.