RV Park & Campground Industry Statistics 2026
Quick answer
The key RV park industry statistics for 2026: the U.S. had 5,016 RV park and campground employer establishments in 2023, up 9.4% since 2019 (Hawkto analysis of Census data), while an RV Industry Association study put private campgrounds at about 12,290. RV makers shipped 342,220 RVs in 2025, 8.1 million households own an RV, and over 52 million North American households camped in 2025. Nearly 64% of campers now find campsites through online search.
Owners, lenders and writers keep asking me how big the RV park and campground industry really is. The answers online are scattered, often years old, and rarely sourced. So here are the RV park industry statistics that matter in 2026, each linked to the report or dataset it came from, plus original analysis of U.S. Census data I ran for this page.
I run marketing for Country Home Estates RV Park in Oklahoma, a long-term park with monthly residents and a client since 2023: local SEO, the website, Google Ads, Meta ads and resident newsletters (screenshots are on my RV park SEO services page). That’s why each section ends with a short note on what the numbers mean for filling sites.
You’ll also find a summary of my study of 134 RV park websites. To see how your site compares, the free RV park SEO audit tool runs the same 19 checks in about 30 seconds.
For RV park owners
Want this done for your park?
I have marketed a long-term RV park in Oklahoma since 2023: Google Maps, Google Ads, Facebook ads, the website and resident newsletters. See how I can help with RV park marketing.
Key statistics at a glance
5,016
RV park and campground employer establishments in the U.S. in 2023, up 9.4% from 2019
Source: Hawkto analysis of Census County Business Patterns, 2023
12,290
private campgrounds in the U.S., per RVIA’s campground inventory study
Source: CHM Government Services for RVIA, 2022
342,220
RVs shipped wholesale in 2025, up 2.5% on 2024
Source: RV Industry Association, 2025
8.1M
American households own an RV
Source: Go RVing / RVIA owner profile, 2025
52M+
North American households camped in 2025
Source: KOA Camping & Outdoor Hospitality Report, 2026
$26.8B
value added to U.S. GDP by RVing in 2025
Source: U.S. Bureau of Economic Analysis, 2026
64%
of campers use online search to find campsites, now ahead of word of mouth
Source: RMS, 2026 (nearly 64%)
30%
of 134 RV park homepages have a main heading that says RV park or campground
Source: Hawkto Digital website study, 2026
In this guide
- Key statistics at a glance
- How big is the RV park and campground industry?
- RV parks and campgrounds by state
- RV industry statistics: shipments
- RV ownership statistics
- Camping statistics: who camps and how
- Occupancy, rates and booking windows
- How campers find and book parks
- Our study: how RV park websites score
- Campground industry trends for 2026
- What the numbers mean for marketing your park
- Frequently asked questions
- Sources
How big is the RV park and campground industry?
No single number captures it. Three measures give a fair picture:
- RVing added $26.8 billion to U.S. GDP in 2025. That made it the second-largest “conventional” outdoor activity in the country, and the largest in 10 states. The whole outdoor recreation economy was $704.2 billion, or 2.3% of GDP (U.S. Bureau of Economic Analysis, released November 18, 2026).
- Campers spent $66 billion in local communities in 2025, $5 billion more than in 2024, and average daily spending per person, not counting accommodations, passed $200 (KOA).
- The 342,220 RVs shipped in 2025 had a retail value of $20.40 billion (RVIA Industry Profile).
These measure different things (value added, camper spending, sticker value of new units), so don’t add them together.
Campground industry statistics: RV parks and campgrounds by state
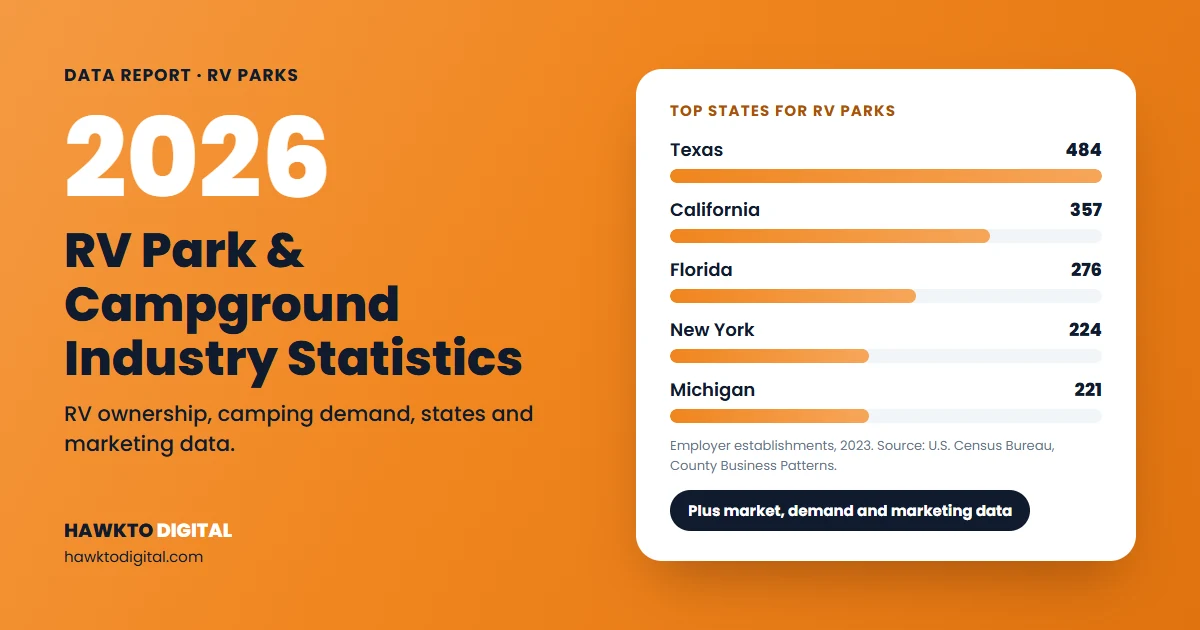
I analyzed the U.S. Census Bureau’s County Business Patterns (CBP) data for industry code 721211, “RV Parks and Campgrounds”. The newest year is 2023. I compared it with 2019 and divided each state’s count by its 2023 population.
CBP counted 5,016 RV park and campground employer establishments in 2023, up 9.4% from 4,586 in 2019. They employed 26,313 people in mid-March 2023 and paid $1.02 billion in annual payroll: 1.50 establishments per 100,000 residents.
| State | Establishments 2023 | 2019 | Change | Employees 2023 | Per 100,000 residents |
|---|---|---|---|---|---|
| 1. Texas | 484 | 396 | +22.2% | 2,371 | 1.58 |
| 2. California | 357 | 371 | -3.8% | 2,985 | 0.91 |
| 3. Florida | 276 | 248 | +11.3% | 3,063 | 1.20 |
| 4. New York | 224 | 209 | +7.2% | 473 | 1.13 |
| 5. Michigan | 221 | 197 | +12.2% | 1,110 | 2.19 |
| 6. Pennsylvania | 210 | 191 | +9.9% | 878 | 1.61 |
| 7. Wisconsin | 187 | 164 | +14.0% | 735 | 3.15 |
| 8. Washington | 186 | 202 | -7.9% | 861 | 2.37 |
| 9. Arizona | 163 | 169 | -3.6% | 1,555 | 2.18 |
| 10. Ohio | 157 | 160 | -1.9% | 519 | 1.33 |
| United States | 5,016 | 4,586 | +9.4% | 26,313 | 1.50 |
Hawkto Digital analysis of U.S. Census Bureau County Business Patterns 2019 and 2023 (NAICS 721211, all 50 states and DC) and Census Vintage 2024 state population estimates for 2023. Employees are mid-March counts.
Texas leads by a wide margin, and it also received the most wholesale RV shipments in 2025, at 9.85% of the total (RVIA). Florida has the most RV park employees (3,063) and California the largest payroll ($129.1 million). Adjust for population and small, outdoorsy states lead:
RV parks and campgrounds per 100,000 residents: top 10 states
Employer establishments (NAICS 721211) per 100,000 residents, 2023
Among states with at least 50 establishments, Utah grew fastest from 2019 to 2023 (67 to 93, up 38.8%), followed by Montana (up 33.3%) and Alabama (up 31.4%). California (down 3.8%), Arizona (down 3.6%) and Washington (down 7.9%) shrank.
Why 5,016 is not the number of campgrounds
CBP counts employer establishments: locations with paid employees during the year. Owner-run parks with no payroll aren’t counted, and neither are most public campgrounds. So the Census figure is a floor for staffed private businesses, not a count of campgrounds.
Industry counts are much higher. For RVIA’s 2022 campground inventory study, CHM Government Services compared four lists of private campgrounds: 9,921 in Dun & Bradstreet under the same industry code, 12,290 in the All Stays app, 13,883 on Campground Reviews and 12,793 in RVIA’s survey list. It used 12,290 as the private market (CHMGS for RVIA). Public campgrounds slightly outnumber private ones (0.81 private to 1 public), but private parks hold 2.5 times as many campsites.
Size explains the gap. In the 2023 CBP file, 3,471 of the 5,016 establishments (69.2%) had fewer than five employees. The typical private park surveyed by OHI (the association formerly called ARVC) has 102 rentable sites, and 74% are independent small businesses (OHI 2024 Industry Outlook; RV PRO).
What this means for owners
Most of your competitors are small, owner-run parks with no marketing team, so a well-kept Google profile and a clear website still stand out. My RV park market research guide shows how to size up nearby parks.
RV industry statistics: wholesale RV shipments
Wholesale shipments, the RVs manufacturers send to dealers, show how many new rigs are about to hit the road and look for a site.
RV industry statistics: wholesale RV shipments, 2017 to 2025
Total RV units shipped by manufacturers each year
- 2021 was the record: 600,240 RVs, 19% above the previous record of 504,599 set in 2017 (RVIA).
- 2023 was the low point: 313,174 units, down 36.5% on 2022 (RVIA).
- 2025 grew modestly: 342,220 units, up 2.5%. Towables were 306,191 (up 2.5%), motorhomes 36,029 (up 3.3%) and park model RVs 4,305 (up 9.6%) (RVIA).
- 2026 is running lower: through September 2026, 230,511 RVs had shipped, down 13.7% from 267,234 at the same point in 2025. Towables were down 15.6%, while motorhomes were up 2.0% and park models rose to 3,804 from 3,193 (RVIA, September 2026).
What this means for owners
The RVs built in the 2020 to 2022 boom are still on the road, but fewer new ones are arriving in 2026. Expect to compete harder for each traveler. Rising park model shipments are worth watching if you have room for longer-term units.
RV ownership statistics
The newest public figure comes from the 2025 Go RVing RV Owner Demographic Profile, conducted by Ipsos (RVIA):
- 8.1 million American households own an RV.
- The median owner is 49, down from 53 in 2021, and 46% of owners are aged 35 to 54.
- Owners use their RV a median of 30 days a year, up 50% from 20 days in the 2021 study.
- 36% are first-time owners, and 43% have children under 18 at home.
- 22% have someone at home who works remotely.
- 16.9 million households say they have a strong interest in buying an RV in the next five years.
You’ll still see 11.2 million quoted widely. That’s from the 2021 edition of the study (RVIA, 2021). The 2025 public summary doesn’t compare its count with 2021’s, so I wouldn’t read the two as a drop of 3 million owners. Use 8.1 million, with the year.
What this means for owners
Today’s RV owner is younger, often has kids, and may work from your park. Put Wi-Fi speeds, family amenities and quiet hours on your website.
Camping statistics: who camps and how
KOA’s 2026 Camping & Outdoor Hospitality Report surveyed 2,834 U.S. and 1,254 Canadian households (KOA). For 2025 it found:
- Over 52 million North American households camped, above pre-pandemic levels.
- Glamping made up 29% of camping experiences, and 31% of new campers chose glamping.
- 31% of campers plan to spend more nights camping in 2026.
- RV preference among campers was 47%, matching 2023 and the lowest since the report began (RV PRO on the KOA report).
RMS’s 2026 survey of 1,500 campers in the U.S., U.K., Australia and New Zealand found 66% plan to camp more in the coming year, up eight points (RMS via Hospitality Net).
The National Park Service recorded 323,014,305 recreation visits and 13,016,577 overnight stays in 2025 (NPS). Overnight stays fell 2.4% from 2024, in a year with a 43-day partial government shutdown (NPS). For a park near a national park, those visitors are a demand pool.
What this means for owners
Fewer than half of campers now say they prefer an RV. If you have cabins, tent sites or glamping units, give each its own page and profile photos, because guests search for them separately.
Campground occupancy, rates and booking windows
The best recent operating data comes from Campspot’s booking platform. Its December 2025 Data Dig, built on anonymized platform data, found (Campspot and OHI):
- Summer 2025 occupancy (June 1 to August 31) fell year over year in every region except the Pacific Northwest, which rose 1% to 2%.
- Rates rose anyway: average daily rates grew more than 4% on average in every region except the Midwest, where they were flat.
- Transient stays (under 28 days) averaged about 3 nights in most regions, and more bookings than in 2024 were made 7 to 59 days ahead.
In OHI’s 2024 survey of 259 private park operators, the typical park said campers book four months ahead and stay five nights, though 39% said their typical booking is four weeks out or less (OHI). For a broad national view, the RVIA campground study estimated campgrounds were 76% full in June to August and 54% full across the year, using 2020 and 2021 data (CHMGS for RVIA). Treat that as context, not a 2026 benchmark.
How campers find and book RV parks
This is the data that matters most for marketing:
How campers find and book campsites
Share of campers or reservations, 2025 to 2026
- Online search has overtaken word of mouth, a first for RMS’s annual report.
- Online and mobile booking keep growing. On Campspot, 65% of transient reservations were booked online in January to September 2025, and mobile app bookings rose to 35% of Marketplace bookings from 29% in 2024.
- AI is early. The Dyrt’s 2026 Camping Report found 33.6% of campers trust AI to recommend a campground, but only 10.3% have used it to plan a trip (The Dyrt).
Reviews shape the choice. BrightLocal’s 2026 survey of 1,002 U.S. consumers (about local businesses in general, not campgrounds) found 97% read reviews for local businesses, 74% only care about reviews from the last three months, and 47% won’t use a business with fewer than 20 reviews. After positive reviews, 54% check the business’s website (BrightLocal).
On the park side, OHI’s 2024 survey found 75% of parks market on social media, 46% on camping travel websites and 9% do no marketing at all, while 34% sell sites through an online travel agency, up from 24% in 2022 (OHI). OHI’s technology survey found 73% of parks offer online booking (OHI Technology Trends 2024).
What this means for owners
Campers search, read recent reviews, then book on your website, often on a phone. Each step is a place to lose them. Letting guests pick their exact site online helps: nearly 85% say it makes them more likely to book.
Our study: how 134 RV park websites score
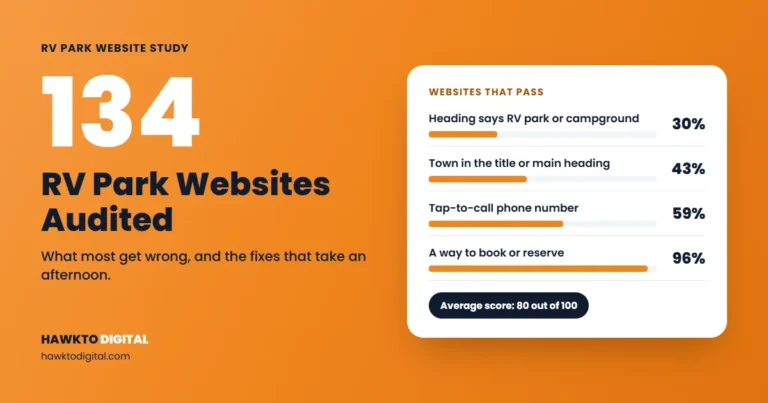
In November 2026 I ran the same 19 checks on 134 independent RV park websites in 12 states using my RV park SEO audit tool. The average score was 80 out of 100 and the median 82. The booking basics are mostly in place. The gaps are in telling Google what the park is and where it is (full study and method).
What 134 RV park websites get right and wrong
Share of websites that fully pass each check, November 2026
Also: 19% of homepages had no main heading at all, 39% had no business schema (the code that tells Google your name, address and business type), and on 34% the phone number couldn’t be tapped to call or only appeared on an inner page.

What this means for owners
A site that doesn’t say “RV park” and your town in its title and heading is easy for Google to skip. Most fixes take an afternoon; the RV park website design guide covers the rest.
Campground industry trends for 2026
These are the campground industry trends I’d plan around:
- Fewer new RVs, steady camping. Shipments are down 13.7% so far in 2026, but 31% of campers plan more nights.
- Search is the front door, and mobile booking keeps rising.
- AI is starting to recommend businesses. BrightLocal found 45% of consumers used ChatGPT or other AI tools for local recommendations in 2026, up from 6% a year earlier. Among campers it’s lower: 14% in RMS’s survey.
- Rates up, occupancy softer in most regions in summer 2025.
- Younger owners, more glamping. The median RV owner is 49, glamping was 29% of camping in 2025, and park model shipments are up.
What the numbers mean for marketing your park
Every statistic above points the same way: campers search, compare on Google, check reviews, then book on your site, often from a phone. Here’s what I’d do this quarter:
1. Google Business Profile and Maps
Most “RV park near me” searches end on the map. Check your category, hours, phone and website link, add fresh photos of each site type, and post monthly. My Google Business Profile guide for RV parks covers every field, the free Google Maps rank checker shows where you appear around town, and how to rank higher on Google Maps covers the rest.
2. Reviews
With 74% of consumers caring only about reviews from the last three months, a steady stream beats a big total. Ask every departing guest and reply to every review. The RV park reviews guide has scripts.
3. Your website
Put “RV park” and your town in the title and main heading, make the phone number tappable, show recent reviews on the homepage, and let guests book a specific site online. Then run the free audit. The RV park SEO guide and how to increase RV park occupancy cover the next steps.
4. Budget
Most of this is time, not money. If you’d rather hand it off, the RV park marketing cost guide lays out what agencies charge, and the RV park marketing guide covers channels beyond Google.
RV park industry statistics FAQ
Frequently asked questions
Quick answers to the questions people ask most about the RV park and campground industry.
QHow many RV parks and campgrounds are there in the US?
It depends on what you count. The Census Bureau counted 5,016 RV park and campground employer establishments in 2023, which leaves out parks with no paid staff. An RV Industry Association study in 2022 estimated about 12,290 private campgrounds, and public campgrounds add thousands more.
QWhich state has the most RV parks?
Texas, with 484 RV park and campground employer establishments in 2023, followed by California (357) and Florida (276). Per resident, Maine leads with about 10 per 100,000 people, followed by South Dakota and Wyoming.
QHow many Americans own an RV?
8.1 million American households own an RV, according to the 2025 Go RVing RV Owner Demographic Profile. The often-quoted 11.2 million comes from the 2021 edition of the study.
QHow many RVs were shipped in 2025?
342,220, up 2.5% on 2024, according to the RV Industry Association. The record was 600,240 in 2021. Through September 2026, shipments were down 13.7% on the same point in 2025.
QHow do campers find RV parks and campgrounds?
Mostly through online search. In the RMS 2026 report, nearly 64% of campers used online search to find campsites, ahead of the 60% who rely on friends and family. Reviews, Google Maps and the park’s own website then decide where they book.
QIs the RV park industry growing?
Slowly. RV park and campground employer establishments grew 9.4% from 2019 to 2023, and camping households stayed above 52 million in 2025. New RV shipments are down in 2026, and Campspot data shows summer 2025 occupancy dipped in most regions while rates rose.
Sources
Sources
Checked in November 2026.
- U.S. Census Bureau, County Business Patterns, 2019 and 2023, and 2023 state population estimates; Hawkto analysis
- CHM Government Services for RVIA, Campground Industry Market Analysis (2022); RVIA news, March 29, 2022
- RVIA, December 2025 shipment report
- RVIA, September 2026 shipment report
- RVIA year-end shipment reports: 2024, 2023, 2022, 2021, 2020, 2019
- RVIA, 2025 RV Industry Profile
- RVIA, 2025 Go RVing RV Owner Demographic Profile
- RVIA, 2021 Go RVing RV Owner Demographic Profile
- U.S. Bureau of Economic Analysis, Outdoor Recreation Economic Statistics, 2025 (November 2026)
- Kampgrounds of America, 2026 Camping and Outdoor Hospitality Report (April 2026)
- RV PRO on the KOA report (April 2026)
- RMS, 2026 State of the Outdoor Accommodation Report (via Hospitality Net) (September 2026)
- Campspot and OHI, The Data Dig: 2026 Occupancy Outlook (December 2025)
- OHI, 2024 Industry Outlook Report
- OHI, Technology Trends 2024
- RV PRO, National ARVC Rebrands as OHI (2023)
- National Park Service, 2025 visitation release and annual visitation highlights
- BrightLocal, Local Consumer Review Survey 2026 (February 2026)
- The Dyrt, 2026 Camping Report
- Hawkto Digital, RV park website study, 134 websites, November 2026
Cite this data
You’re welcome to use any chart or figure from this page in articles, reports and presentations. Please credit Hawkto Digital and link to this page.
Hasan, M. (2026). RV Park & Campground Industry Statistics 2026. Hawkto Digital. https://hawktodigital.com/rv-park-industry-statistics/
See how your park’s website measures up
Run the same 19 checks from the study on your own website. It’s free, takes about 30 seconds, and every problem comes with a plain-English fix.

About the author
Mehedi Hasan is the founder of Hawkto Digital and is Google, HubSpot and Semrush certified. He has run local SEO, reviews, email, Google Ads and Meta ads for a long-term RV park in Oklahoma since 2023, and marketing for local businesses across the US. Read his story or see pricing.