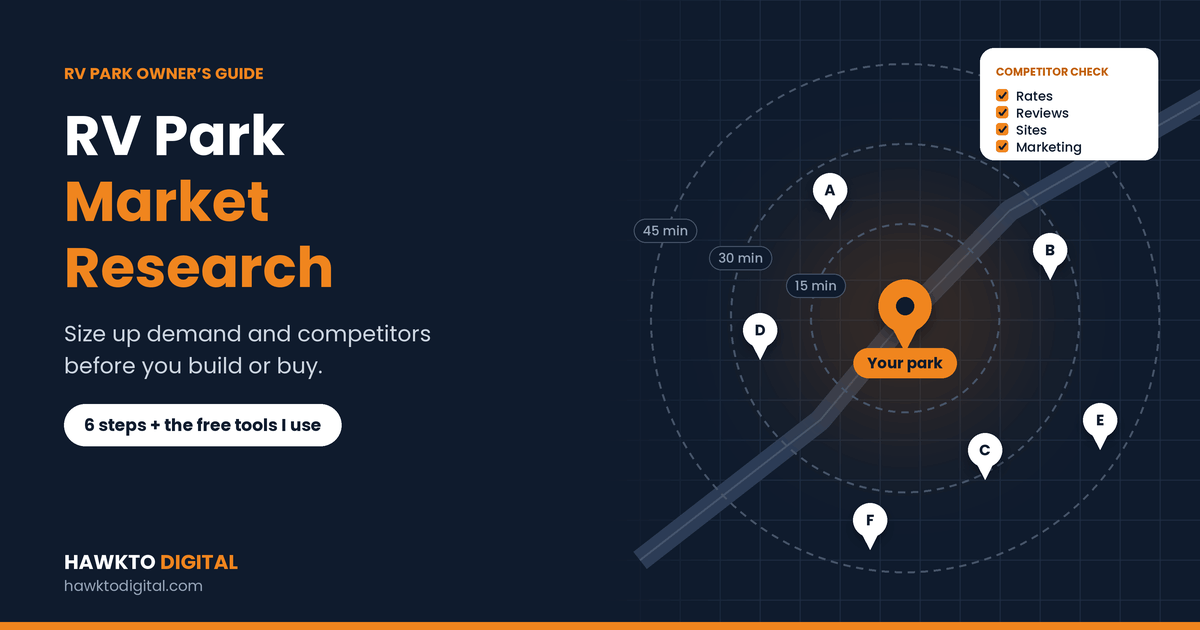
RV Park Market Research: Size Up Demand and Competitors Before You Build or Buy
Quick answer
RV park market research answers five questions before you build, buy or expand: who will stay, how many nights a year they’ll fill, who already serves them, what you can charge and how guests will find you. Define your trade area, check the demand drivers (attractions, highways, events, workers, snowbirds and searches), list every competitor, price real dates on their booking pages and audit their marketing. The gaps you find become your site mix, your prices and your marketing message. If you’re borrowing money, add a professional feasibility study.
A busy July weekend can make any RV park look like a gold mine. The full year tells a different story. Across parks on Campspot’s booking platform, occupancy for all site types averaged 34.8% over the 12 months to March 2025 (Campspot and OHI). Summer fills up. Many weeknights and slow-season months don’t.
The national market is steady, not booming. RV shipments rose 2.5% in 2025 to 342,220 units (RVIA). 8.1 million US households own an RV, and 16.9 million more say they’re strongly interested in buying one within five years (Go RVing 2025 study). With steady national demand, your local market decides whether your park fills.
I’ve marketed Country Home Estates, a long-term RV park in Oklahoma, since 2023, and I see the same thing every year: marketing can fill a park faster, but it can’t create demand that isn’t there. This guide shows you how to research an RV park market step by step, including the free tools I use for competitive analysis, so you know what to build, what to charge and how to market before you spend.
In this guide
- The 5 questions market research answers
- Step 1: Define your trade area
- Step 2: Size up demand
- Step 3: Map every competitor
- Step 4: Price competitors like a guest
- Step 5: Audit competitors’ marketing
- Step 6: Turn research into a plan
- Buying a park? Check its marketing too
- When to pay for a feasibility study
- 6 market research mistakes
- Frequently asked questions
- Sources
For RV park owners
Want this done for your park?
I have marketed a long-term RV park in Oklahoma since 2023: Google Maps, Google Ads, Facebook ads, the website and resident newsletters. See how I can help with RV park marketing.
The 5 questions RV park market research answers
Whether you’re building a new park, buying one or trying to fill the one you have, good research answers the same five questions:
| Question | What you’re looking for | Where to find it |
|---|---|---|
| Who will stay? | Overnight travelers, weekend campers, monthly workers, snowbirds, families | Demand drivers in your area, competitors’ reviews |
| How many nights a year? | Demand in peak, shoulder and slow seasons | Competitors’ availability, events, traffic counts, search trends |
| Who already serves them? | Every RV park, resort and public campground nearby | Google Maps, booking sites, county planning agendas |
| What can you charge? | Nightly, weekly and monthly rates by season | Competitors’ booking pages, pricing reports, local rents |
| How will guests find you? | The channels competitors win on, and the ones they ignore | Google search and Maps, listings, ads, reviews |
Steps 1 and 2 below cover demand. Steps 3 to 5 cover your competitors. Step 6 turns what you find into decisions.
Step 1: Define your trade area
Your trade area is where your guests come from and where your competitors are. It depends on the kind of park you are, or want to be:
- Highway stopover: guests choose a park close to their route. Your competitors are parks on the same stretch of highway, near the same exits.
- Destination park: guests come for a lake, a national park, a beach or a town. Your competitors are every park within an easy drive of that attraction, including public campgrounds.
- Long-term and workforce park: guests compare you with other places to live near their job. Your competitors include apartments, extended-stay hotels and other parks.
- Snowbird park: guests compare parks across a whole region on community, amenities and the price for the season.
As a starting point, I map a 30- to 45-minute drive around the main attraction for a destination park, and the highway in both directions for a stopover park. Then I adjust once I see where the competitors cluster. Many parks serve more than one type of guest, so they need more than one trade area.
Free check: In Google Maps, search “rv park” and “campground”, then zoom out until you see where parks cluster. Clusters show you where demand already is.
Step 2: Size up demand
Demand is how many RV nights people want near your park, season by season. You can’t measure it exactly, but free sources give you strong signals:
| Demand driver | What to check | Free source |
|---|---|---|
| Attractions | Yearly visitors to nearby national and state parks, lakes and beaches | NPS visitor statistics, state park and tourism offices |
| Highway traffic | Daily traffic on the nearest interstate or highway | Your state DOT’s traffic count map (search “[state] traffic counts”) |
| Events | Festivals, races, rallies, tournaments, college games | Local tourism office and event calendars |
| Workers | Plants, pipelines, hospitals, construction and energy projects that bring traveling workers | County economic development office, local news, job boards |
| Snowbirds | Winter visitors and seasonal stays | Competitors’ seasonal rates and waitlists, local RV clubs |
| Search demand | How often people search for RV parks in your town, and when | Google Trends, Google Keyword Planner |
| Local rents | What a monthly guest would pay for an apartment instead | HUD Fair Market Rents |
Read the signals together. A busy interstate, a state park that sells out every summer and a new plant hiring for two years point to a park that can mix overnight and monthly guests. One big summer festival and little else points to a seasonal park with a long, quiet off-season.
Check the slow season, not just summer
Demand changes more by season and region than most first-time owners expect. Campspot’s 2026 Occupancy Outlook found that most regions peak from around late May, and short stays average about three days. The Sunbelt is different: it has the longest stays, the highest share of seasonal bookings and occupancy that holds steady all year (Campspot and OHI).
Find out what happens in your area in February or November, not just July. If every park nearby is empty for five months, your plan needs monthly guests, winter events or lower running costs.
Let competitors’ calendars show you demand
The best demand signal is what’s already booked. Try to book a site at each nearby park for:
- a Saturday night in peak season,
- a Tuesday night in spring or fall,
- a full month in your slow season.
Sold-out dates show unmet demand. Wide-open calendars show you’ll be fighting the same parks for the same guests. Check early and more than once: in Insider Perks’ May 2026 pricing index, sites that sold out did so a median of 131 days, about four months, before check-in (Woodall’s Campground Magazine).
Don’t build on national hype
National numbers make good headlines but poor business plans. In KOA’s 2026 report, 47% of campers prefer RVs, the same as in 2023 and the lowest level since the report began (KOA via RV PRO). RV camping is steady, so the question isn’t whether people camp in RVs. It’s whether enough of them want to stay near you.
Free check: Type “rv park near [your town]” and “rv parks [your town]” into Google Keyword Planner or Google Trends. A clear summer spike with flat winters tells you how seasonal search demand is.
Step 3: Map every competitor
List every place an RV guest could stay instead of your park, not just the parks that look like yours:
- Google Maps: search “rv park”, “rv resort”, “campground” and “rv park near [town]”, and note every result in your trade area.
- Booking sites and directories: Campspot, Hipcamp, RV LIFE Campground Reviews, Good Sam and KOA.
- Public campgrounds: state parks, national forests and Army Corps of Engineers lakes on Recreation.gov and state park sites. They’re often cheaper, and they compete on price and scenery.
- Parks on the way: county planning and zoning agendas list new RV parks long before they open.
Then build a simple competitor sheet, one row per park, with these columns:
| What to record | Why it matters |
|---|---|
| Distance and drive time from you | Shows which parks guests compare you with |
| Number and type of sites: back-in, pull-through, big-rig, 30/50-amp, full hookup | Shows where supply is thin |
| Nightly, weekly and monthly rates by season | Sets your price range (step 4) |
| Amenities: Wi-Fi, laundry, pool, dog park, store, cabins | Shows what guests expect and what’s missing |
| Google rating, review count and the date of the newest review | Shows who guests trust today |
| Online booking and a site map | Shows who is easiest to book |
| Rules: stay limits, RV age, pets | Shows which guests they turn away |
Ten parks with these columns will teach you more about your market than any national report.
Step 4: Price competitors like a guest
Don’t copy rates from directories, which are often out of date. Price the same dates on each competitor’s own website or booking page: a peak weekend, a midweek night, a week and a month. Note fees, minimum stays and discounts such as Good Sam.
Then compare what you find with national benchmarks. Insider Perks’ 2026 pricing report, built from more than 600,000 data points across 2,110 campgrounds, found (Insider Perks via Modern Campground):
- Location drives price. The median RV site ranged from $44 a night in North Dakota to $109 in Delaware.
- Full hookups pay. They carried a 57% premium over dry camping, about $25.58 a night.
- Pull-throughs add little on their own. They earned just 3.6% more than back-in sites.
- Some amenities show up in rates. Parks with dog parks charged 18.2% more on average, and parks with pools 23.3% more. Wi-Fi no longer changed what parks charge.
- Reviews go with pricing power. Parks with more than 2,000 reviews charged 62% more than parks with fewer than 200.
These are averages across very different markets, so treat them as questions to check locally, not answers.
For monthly sites, compare with local rents. HUD’s Fair Market Rents show typical rents for modest apartments in every county. Monthly guests weigh your site rent plus utilities against that number.
Free check: If you already run a park, look for a competitor rate tool in your booking software. Campspot’s, for example, compares your daily rates with a set of at least five similar parks nearby (Campspot).
Step 5: Audit your competitors’ marketing
This is the step most market studies skip, and it’s where a new or improved park can win fastest. Online search has now overtaken word of mouth as the top way campers find a campsite: 64% use online search, compared with 60% who rely on friends and family (RMS 2026).
Check each competitor on these channels:
| Channel | What to check | Your opportunity if they’re weak |
|---|---|---|
| Google Maps | Who shows in the top 3 for “rv park near [town]”, their categories, photos and review count | A well-optimized profile can win the top 3 |
| Reviews | Rating, how recent the reviews are, and the complaints in 1- to 3-star reviews | Fix what guests complain about and say so |
| Website | Mobile speed, clear rates, online booking, a site map | Be the easiest park to book |
| Listings | Campspot, Hipcamp, RV LIFE, Good Sam, KOA | Get listed where they’re missing |
| Ads | Whether they run Google or Facebook ads, and what they offer | Cheaper clicks when few parks advertise |
| Social and email | How often they post and how guests respond | Build a following before you open |
| AI answers | Which parks ChatGPT or Google’s AI names for your area | Reviews and content that get you named |
Google Maps: who owns the top 3?
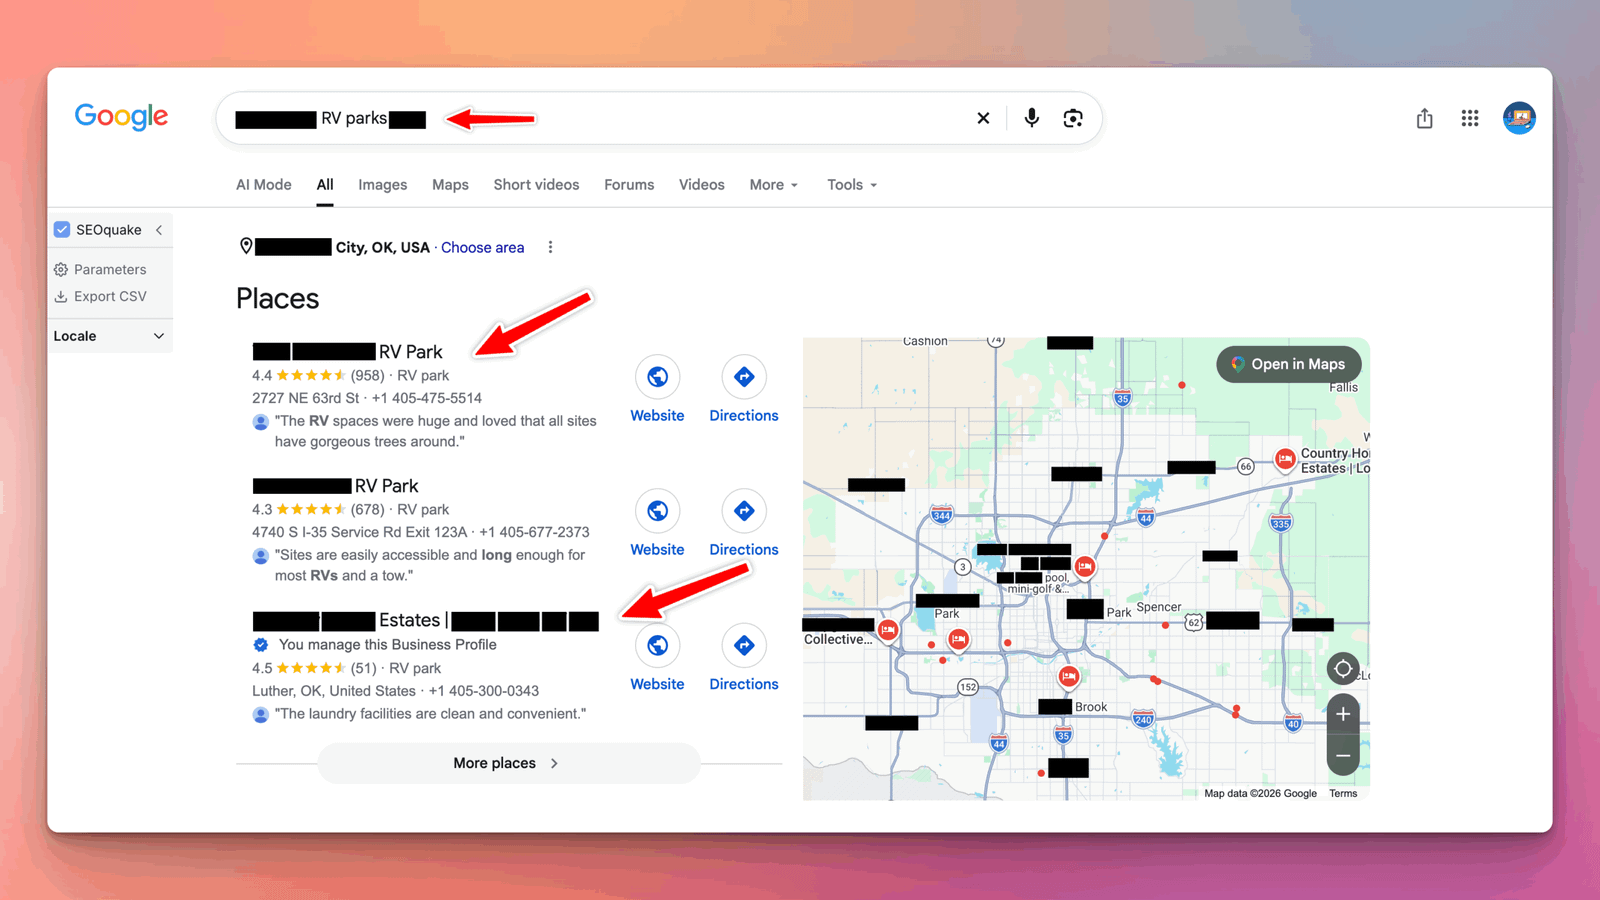
Search “rv park near [town]” and “rv parks [town]” from your phone in a few places around your trade area, because the results change with location. Note who appears in the top 3, their main category, how many photos they have and how they describe themselves. A park that ranks everywhere is your main competitor online, even if it’s not the closest.
For my RV park clients, I track where the park ranks in the Google Maps top 3 for the searches that bring bookings. You can run the same check on any competitor.
My guide on how to rank higher on Google Maps explains what moves these rankings.
Reviews: their complaints are your message
Read every 1- to 3-star review of your top five competitors and note what guests complain about. Across 688,170 camper reviews, Outdoorithm found bathrooms were the number-one complaint, followed by crowds and noise (Outdoorithm). If your competitors’ guests say the same, a spotless bathhouse is a marketing message, not just maintenance.
Check how recent their reviews are, too. 74% of consumers look for reviews from the last three months (BrightLocal 2026), so a park with a high rating but no new reviews is easier to beat than it looks.
Websites and booking: who is easiest to book?
Try to book a site at each competitor on your phone. Count the taps, and note whether you can see rates, pick an exact site and pay online. In the RMS 2026 report, nearly 85% of campers said they’re more likely to book when they can choose their exact site (RMS). In Campspot’s 2025 data, 62% of all reservations were made online, and 35% of bookings on its marketplace came through the mobile app, up from 29% in 2024 (Campspot and OHI).
Ads, listings and AI
- Ads: look up each competitor in the Google Ads Transparency Center and the Meta Ad Library to see if they advertise and what they offer. If no one nearby advertises, clicks are usually cheaper. My RV park advertising guide compares the options.
- Listings: note which booking sites and directories each competitor appears on. Being listed where they aren’t is an easy win.
- AI answers: 14% of campers now use AI tools such as ChatGPT during trip research (RMS 2026). Ask ChatGPT and Google for “the best RV parks near [town]” and note which parks they name, and why.
Want me to run this competitor audit for you?
In a free 30-minute call, I’ll check how the parks around you show up on Google Maps, in reviews, on their websites and in ads, and show you where your park can stand out.
Step 6: Turn your research into a plan
Market research only pays off when it changes what you do. Match each finding to a decision:
| If you find… | Then… |
|---|---|
| Competitors sell out summer weekends months ahead | Demand is there. Price peak dates higher and put your marketing into weekdays and shoulder season. See how to increase RV park occupancy. |
| Nearby parks are full of monthly workers | Plan monthly sites, set clear utility billing and market to local employers. See my guide to long-term RV park tenants. |
| No park nearby fits big rigs or has 50-amp pull-throughs | Build or upgrade for big rigs and lead your marketing with it. |
| Competitors’ reviews complain about bathrooms, Wi-Fi or noise | Make those your strengths and show them in photos. See guest experience marketing. |
| Nobody offers online booking or a site map | Make booking your edge. See RV park website design. |
| One park owns the top 3 on Google Maps | Plan a complete Google profile and a steady flow of reviews from day one. See Google Business Profile for RV parks. |
| Calendars are empty outside summer | Plan for a lean off-season with monthly, snowbird or event guests, or rethink the location. |
Next, write one sentence that says who your park is for and why it’s different, using what you found. For example: “The only park within 20 miles with 50-amp pull-throughs for big rigs, online booking and a bathhouse cleaned three times a day.” That sentence becomes your website headline, your Google profile description and the message in your ads. My RV park marketing guide shows how to build the rest of the plan around it.
Buying an existing park? Check its marketing too
Sellers share revenue and occupancy, but rarely what drives them. Before you buy, ask for:
- Occupancy and revenue by month and site type for at least the last two to three years, straight from the booking software.
- The guest mix: nightly, weekly, monthly and seasonal.
- Where bookings come from: website, phone, booking sites, walk-ins and local employers.
- The review history: a Google rating that has dropped over the past year is a warning sign.
- Ownership of the marketing: the Google Business Profile, website, domain, social accounts and email list, and how each will transfer to you.
- Contracts with booking software, booking sites and marketing vendors.
A park that gets most of its guests from one booking site or one employer carries more risk than its numbers show.
When to pay for a feasibility study
Your own research tells you whether an idea is worth pursuing. A feasibility study is what lenders read. If you’re borrowing to build or buy, ask your lender early whether they require a study and which firms they accept.
A professional study goes beyond this guide, into zoning, building costs, operating budgets and multi-year financial forecasts. As one published example, MMCG Invest prices single-park studies from $4,900 and delivers them in 9 to 16 business days. Its studies include a survey of every park within the drive radius, a revenue model, an operating budget, a five-year forecast and break-even occupancy (MMCG Invest).
Do your own research first anyway. It helps you brief the consultant and question their assumptions, and you’ll need it for your marketing plan, which a feasibility study doesn’t give you. I’m a marketer, not a lender or feasibility consultant, so use this guide alongside professional financial advice.
6 market research mistakes
- Judging demand on a summer weekend. Check a slow month too.
- Counting only parks like yours. Public campgrounds, apartments and extended-stay hotels compete for some of your guests.
- Copying rates from directories. Price real dates on competitors’ own booking pages.
- Trusting national averages. Your county’s rates and seasons matter more.
- Ignoring competitors’ reviews. Their complaints are your easiest marketing message.
- Researching once. Re-check rates and rankings every season, and whenever a new park opens.
Keep reading
Related guides for park owners
Occupancy
How to Increase RV Park Occupancy
15 ways to fill weeknights, gap nights and slow seasons.
Google profile
Google Business Profile for RV Parks
Beat competitors on Google Maps with a complete profile.
RV park market research FAQ
Frequently asked questions
Answers to what owners and buyers ask most about demand, competitors and feasibility.
QWhat is RV park market research?
It’s measuring demand, mapping competitors and checking prices around a proposed or existing RV park, so you know who will stay, how often, at what rate and how they’ll find you before you spend money.
QHow do I do a competitive analysis for an RV park?
List every RV park and campground in your trade area. For each one, record sites, rates, amenities, Google rating and review count, online booking and where they market. Then read their low-star reviews and search Google Maps from a few spots to see who ranks. The gaps you find are your opportunities.
QHow do I know if there’s demand for an RV park in my area?
Look for attractions, busy highways, events, traveling workers and winter visitors. Then try to book at nearby parks for a peak weekend, a weeknight and a month in the slow season. Sold-out dates are the strongest sign of unmet demand.
QHow much does an RV park feasibility study cost?
It depends on the firm and the project. As one published example, MMCG Invest prices single-park studies from $4,900, with larger or complex projects quoted individually. Ask your lender which firms they accept before you hire one.
QWhat’s the difference between market research and a feasibility study?
Market research shows demand, competitors and prices. A feasibility study adds building or purchase costs, operating budgets and multi-year financial projections to decide whether the project works financially, usually for a lender.
QHow much can I charge for an RV site?
Price real dates at nearby competitors first. Rates vary widely by location: in Insider Perks’ 2026 report, the median RV site ranged from $44 a night in North Dakota to $109 in Delaware, and full hookups carried a 57% premium over dry camping.
QHow often should I check my competitors?
At least once a season, and whenever a new park opens or a competitor renovates. Some booking systems, such as Campspot, now include competitor rate tools that update daily.
QCan you research my RV park market and competitors?
Yes. I audit competitors’ Google Maps rankings, reviews, websites and ads, and turn the findings into a marketing plan. See the RV park marketing page or the pricing page, or book a free call.
Sources
Sources
Checked in October 2026.
- Campspot and OHI, The Data Dig: March 2025
- Campspot and OHI, The Data Dig: 2026 Occupancy Outlook
- RV Industry Association, RV Shipments End 2025 with 342,220 Units
- RV PRO, Go RVing Demographic Study: Owners Are Younger, More Diverse (2025)
- RV PRO, KOA Outdoor Hospitality Report: 52M Americans Camped in 2025
- Woodall’s Campground Magazine, Insider Perks OHPI May 2026
- Modern Campground, Insider Perks 2026 pricing report
- RMS, 2026 State of the Outdoor Accommodation Report (via Hospitality Net)
- PinMeTo, BrightLocal Local Consumer Review Survey 2026
- Outdoorithm, Camping Report Card findings (June 2026)
- MMCG Invest, RV Park Feasibility Study
- HUD User, Fair Market Rents
- Campspot, Advertised Rates Comp Signals Dashboard
Know your market before you spend
Book a free 30-minute call. I’ll look at the parks around you on Google Maps, their reviews, websites and ads, and show you where your park can stand out, whether you hire me or not.

About the author
Mehedi Hasan is the founder of Hawkto Digital and is Google, HubSpot and Semrush certified. He has run local SEO, reviews, email, Google Ads and Meta ads for a long-term RV park in Oklahoma since 2023, and marketing for local businesses across the US. Read his story or see pricing.